Volume Profile Lands in MANTIS — See Where the Market Actually Traded
Volume Profile lands in MANTIS
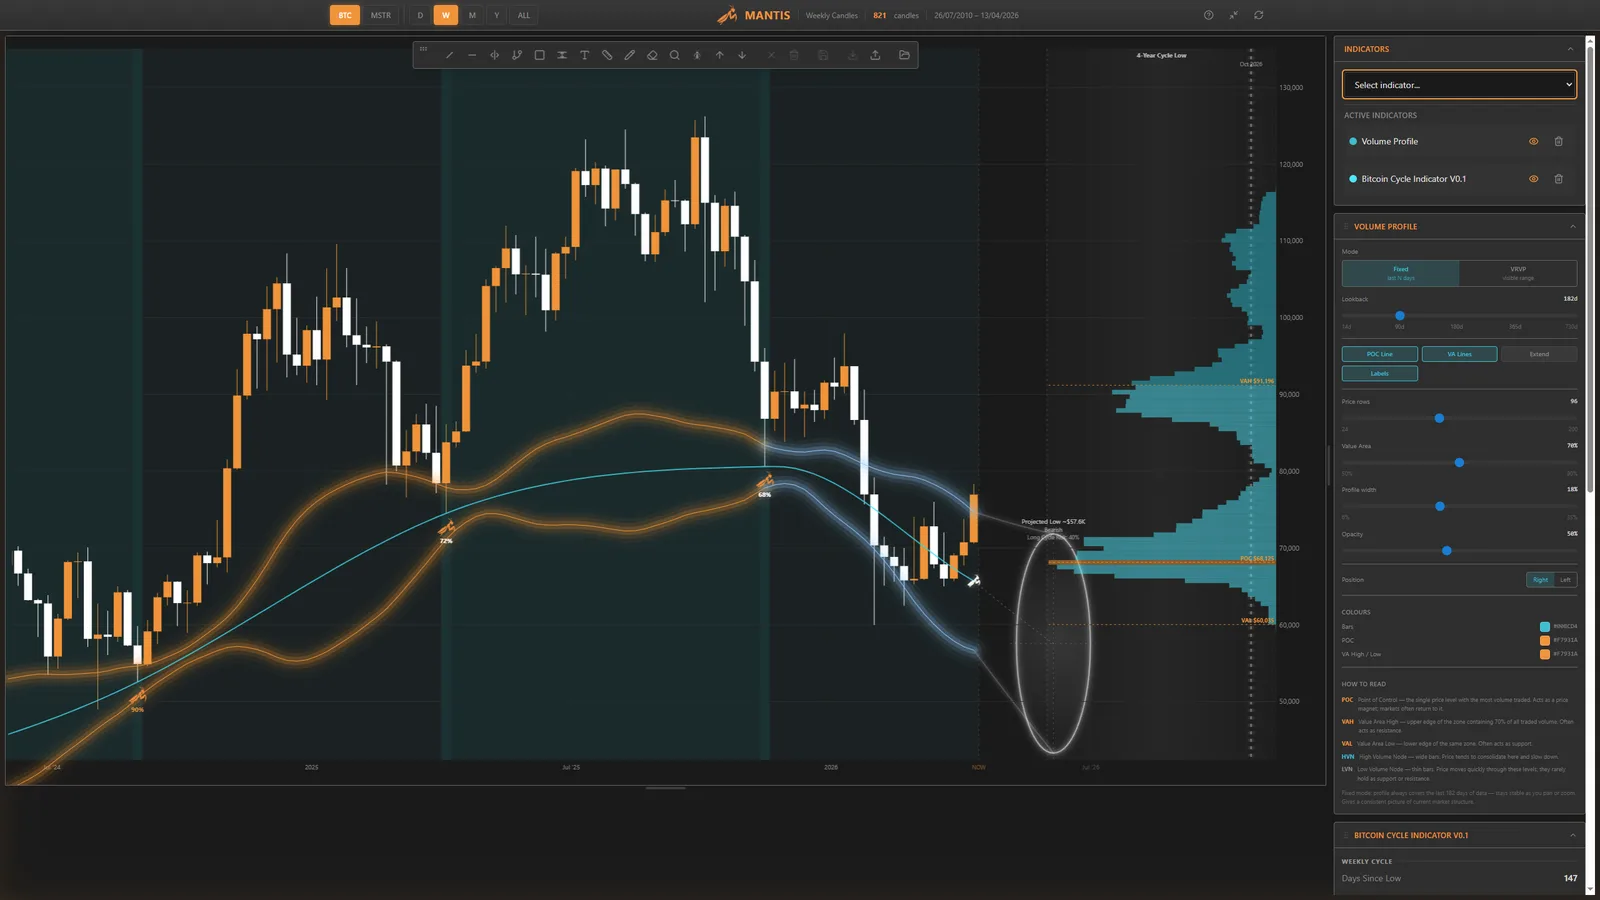
We have shipped Volume Profile in the MANTIS desktop app: a fixed-range, volume-at-price histogram drawn directly on the chart, beside price, so you can see where the market did business—not only when candles printed.
What you get
- POC (Point of Control) — the price level with the most traded volume over your chosen lookback. Often acts as a magnet when price revisits the zone.
- Value area (default 70%) — the band where most of the auction happened.
- VAH / VAL — value area high and low: the edges where acceptance tends to flip into rejection (or the opposite, on a genuine breakout).
- Tunables — lookback, point size, value-area percentage, profile width, opacity, and toggles for POC/VA lines and labels so the panel stays readable on busy layouts.
Why it fits MANTIS
Cycle work answers when the next major low window is likely. Volume Profile helps answer which price neighbourhood the market has already agreed was important over months of real trading—orthogonal data, same idea: less narrative, more structure.
The in-app “How to read” blurb is there on purpose: this is a tool for serious chart literacy, not decoration.
Try it
Update to the latest build, open BTC weekly (or your usual timeframe), enable Volume Profile from the indicator stack, and tune the lookback to match the horizon you care about. Line it up alongside the Bitcoin Cycle Indicator—time and price in one view.
Disclaimer: Not financial advice. Indicators are for education and research; markets can always invalidate historical structure.
Stay patient. Stay focused. Be the mantis.