The Mission: Turning 0.21 BTC Into 1 Whole Bitcoin Through Cycle Analysis and Education
The Mission: Turning 0.21 BTC Into 1 Whole Bitcoin Through Cycle Analysis and Education
When MANTIS launched, it was a cycle timing tool. A precision instrument for answering one question: when is the next weekly cycle low due, and at what price?
That question still sits at the heart of everything. But over the past few months, MANTIS has grown into something more structured — a platform for studying four accumulation frameworks across Bitcoin and two Bitcoin-correlated assets, all grounded in the same historical cycle data.
The personal goal driving that development: to understand whether disciplined, cycle-aware accumulation starting from 0.21 BTC could compound — across two or more market cycles — toward a whole Bitcoin. Not a promise. Not a prediction. A question worth studying carefully.
Why 0.21 BTC as a reference point? There will only ever be 21 million Bitcoin. Divide by a global population and the arithmetic is stark — it is the threshold where scarcity becomes personal. Many in the Bitcoin community treat it as a meaningful milestone. We use it as the starting point for our historical backtest models.
Important Disclaimer This article is for educational and informational purposes only. It does not constitute financial advice, investment recommendations, or a solicitation to buy or sell any asset. All frameworks described below are personal research tools — they are not signals, not recommendations, and not a guarantee of any outcome. Cryptocurrency markets are highly volatile and involve substantial risk of loss. Past performance is not indicative of future results. Always do your own research and consult qualified financial professionals before making any investment decisions.
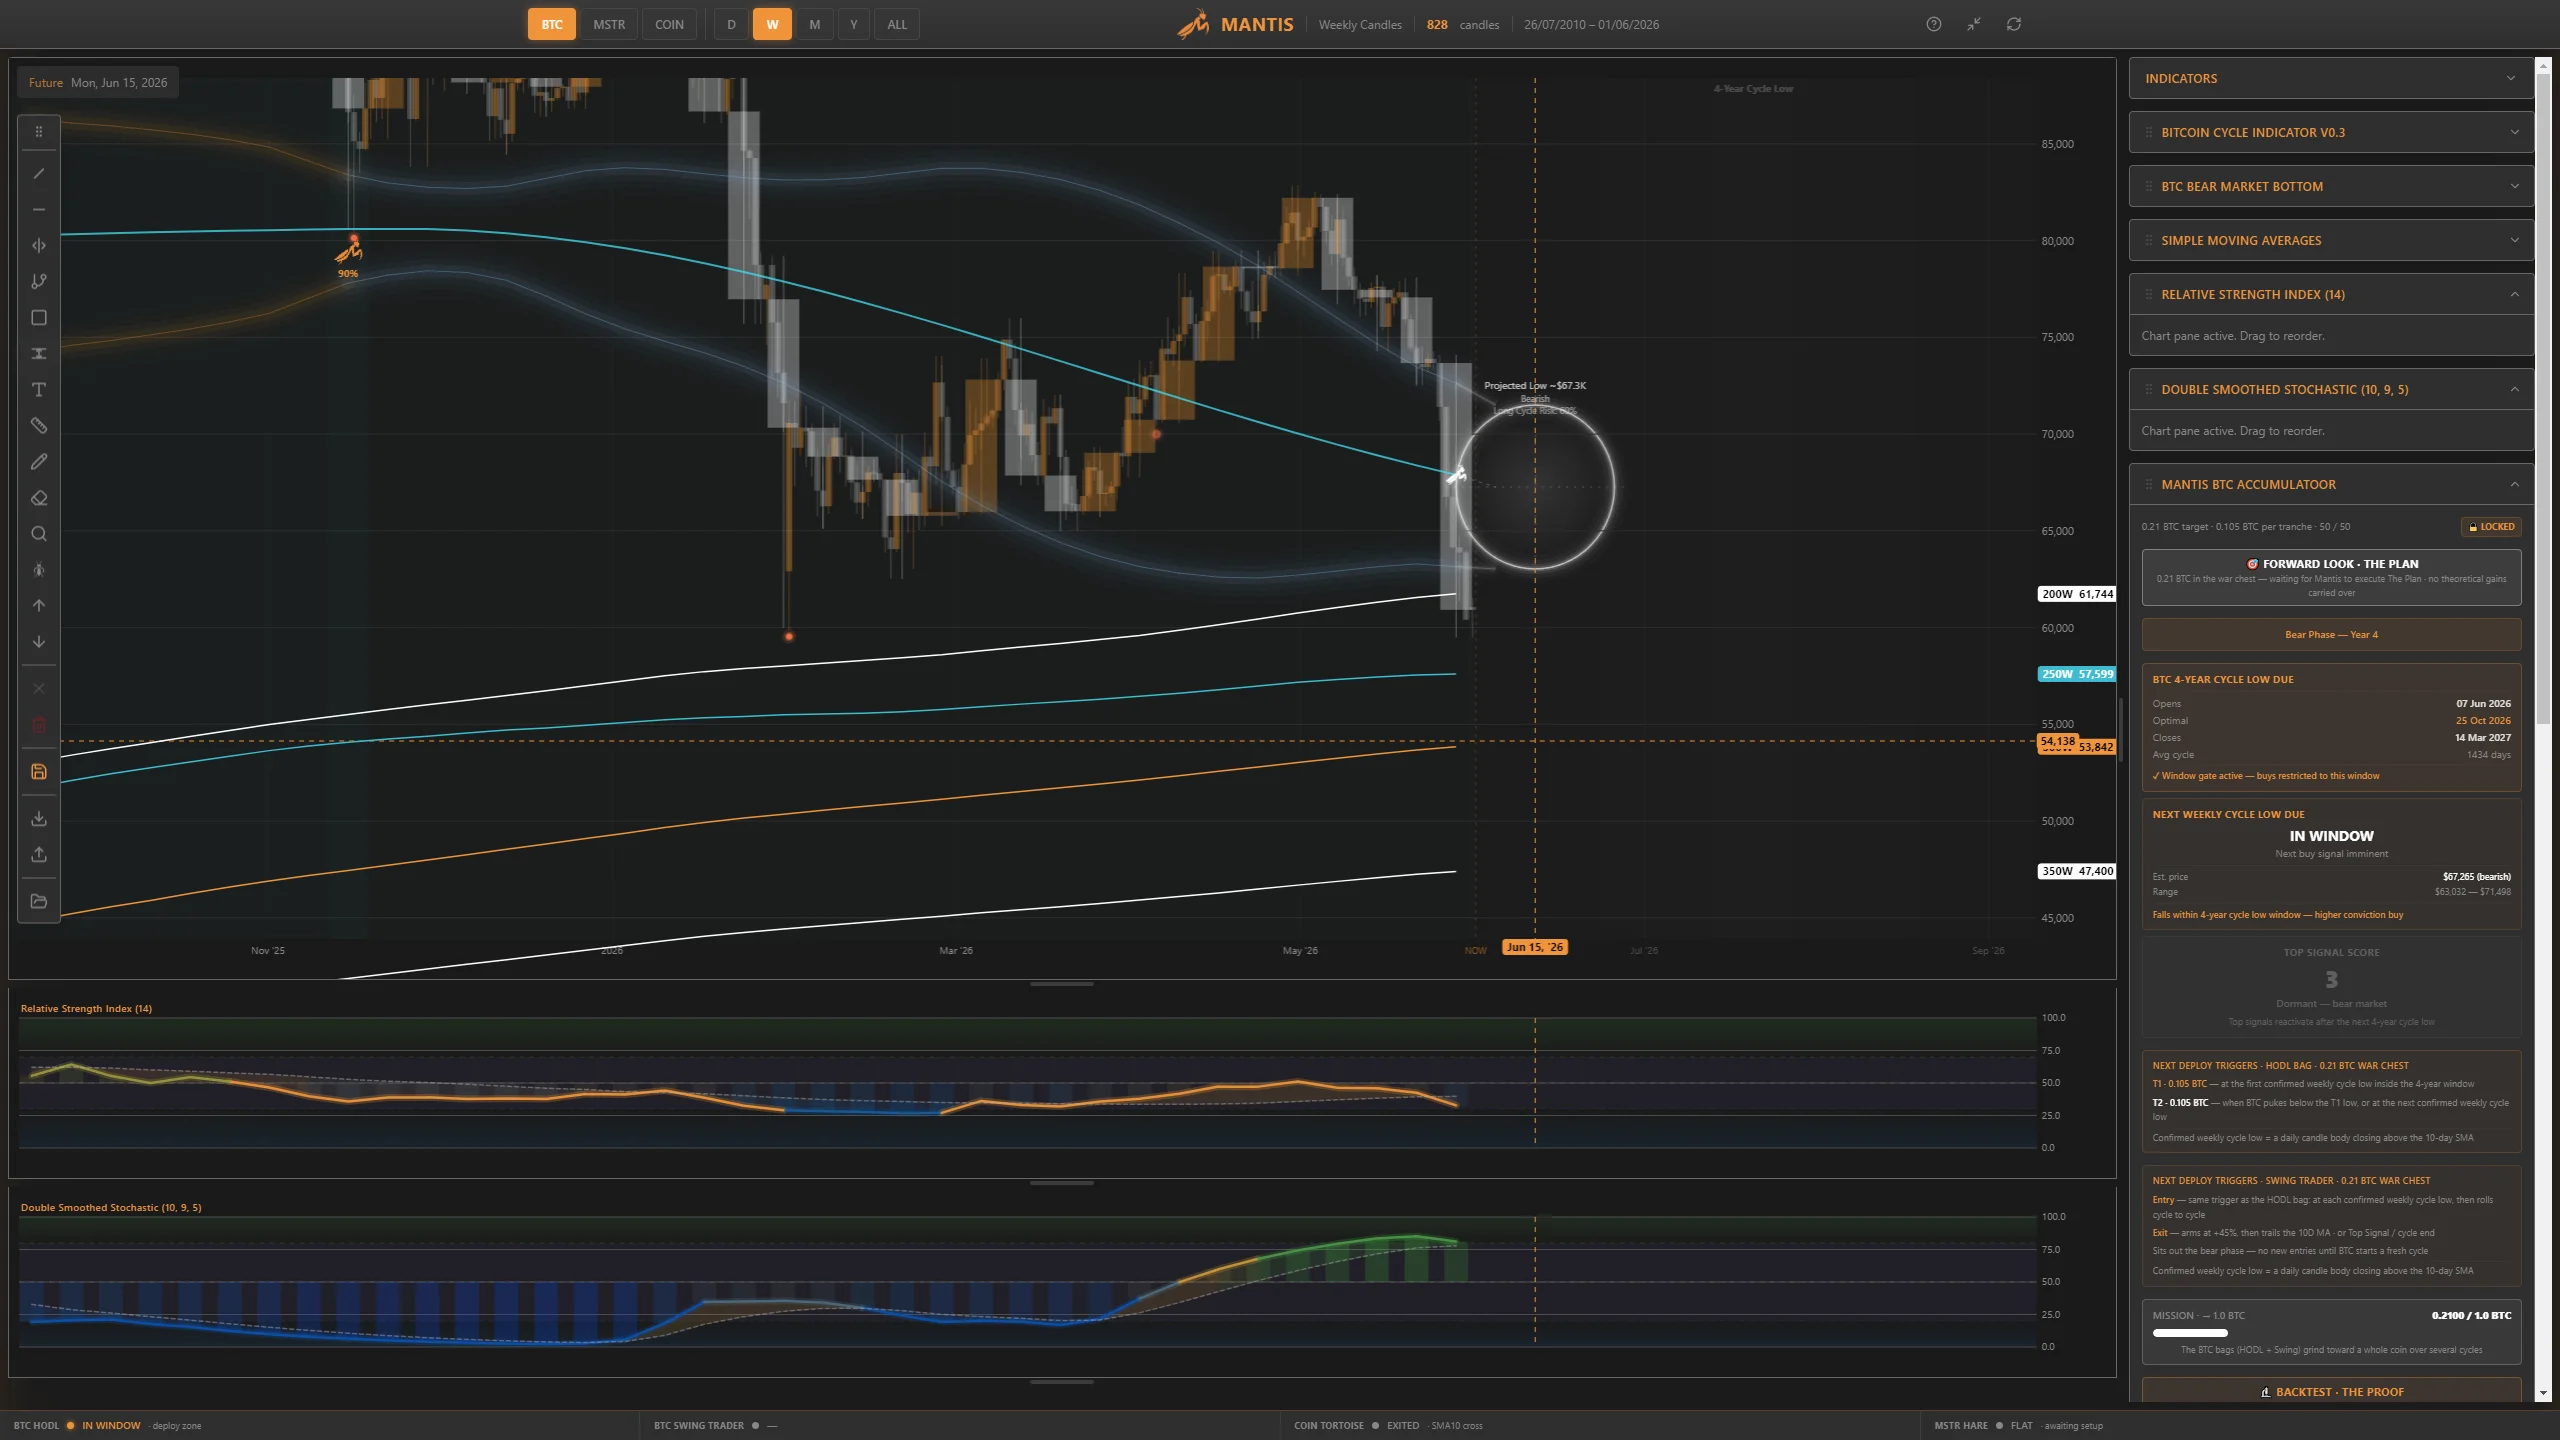
Framework 1 — The BTC HODL Accumulatoor
This is the foundational framework — the one the other three are built around.
The historical study examines what happens when an allocation is made into the 4-year cycle low in two tranches, rather than a single entry.
The first modelled entry fires at the first confirmed weekly cycle low inside the 4-year accumulation window — identified by a daily candle body closing above the 10-day SMA after a swing low prints. The cycle indicator must flag it, the confidence score must clear the threshold, and price must confirm.
The second modelled entry is triggered if price extends further — specifically if it reaches a significantly lower level below the first entry, reflecting the kind of capitulation flush that has historically characterised final bear market lows — or at the next confirmed weekly cycle low, whichever occurs first.
Once both modelled entries are in place, the framework studies distribution using the MANTIS BTC Top Signal — a composite that scores the cycle top across timing, price extension, and RSI. The backtest models a conviction-weighted distribution approach, concentrating exits at the highest-scoring periods rather than a single point.
A permanent hold allocation is modelled as never sold, reflecting the long-term conviction that is central to the Bitcoin accumulation thesis.
Framework 2 — The BTC Swing Trader
This framework studies what happens when entries are modelled at each confirmed weekly cycle low throughout the bull market — rather than just the 4-year macro low.
Where the Accumulatoor makes one set of entries and waits, the Swing Trader framework is active across every weekly cycle. The backtest models an entry at the first daily candle close above the 10-day SMA after each confirmed weekly low, and studies how trailing exit approaches have historically performed through the subsequent rally.
The exit logic varies by phase of the 4-year cycle:
During bull market legs — the backtest models a trailing 10-day SMA stop, activated once the position reaches a target threshold. The framework studies how long historically the rally continued while the SMA held.
As the 4-year top approaches — the Swing Trader framework hands off to the BTC Top Signal for the final leg, studying the same conviction-weighted distribution approach used in the Accumulatoor.
Year 4 sit-out condition: the framework models a pause on new entries when the 4-year cycle enters its bear phase — determined by weeks elapsed since the last macro low. This studies the effect of not attempting to catch falling knives in a structural bear market.
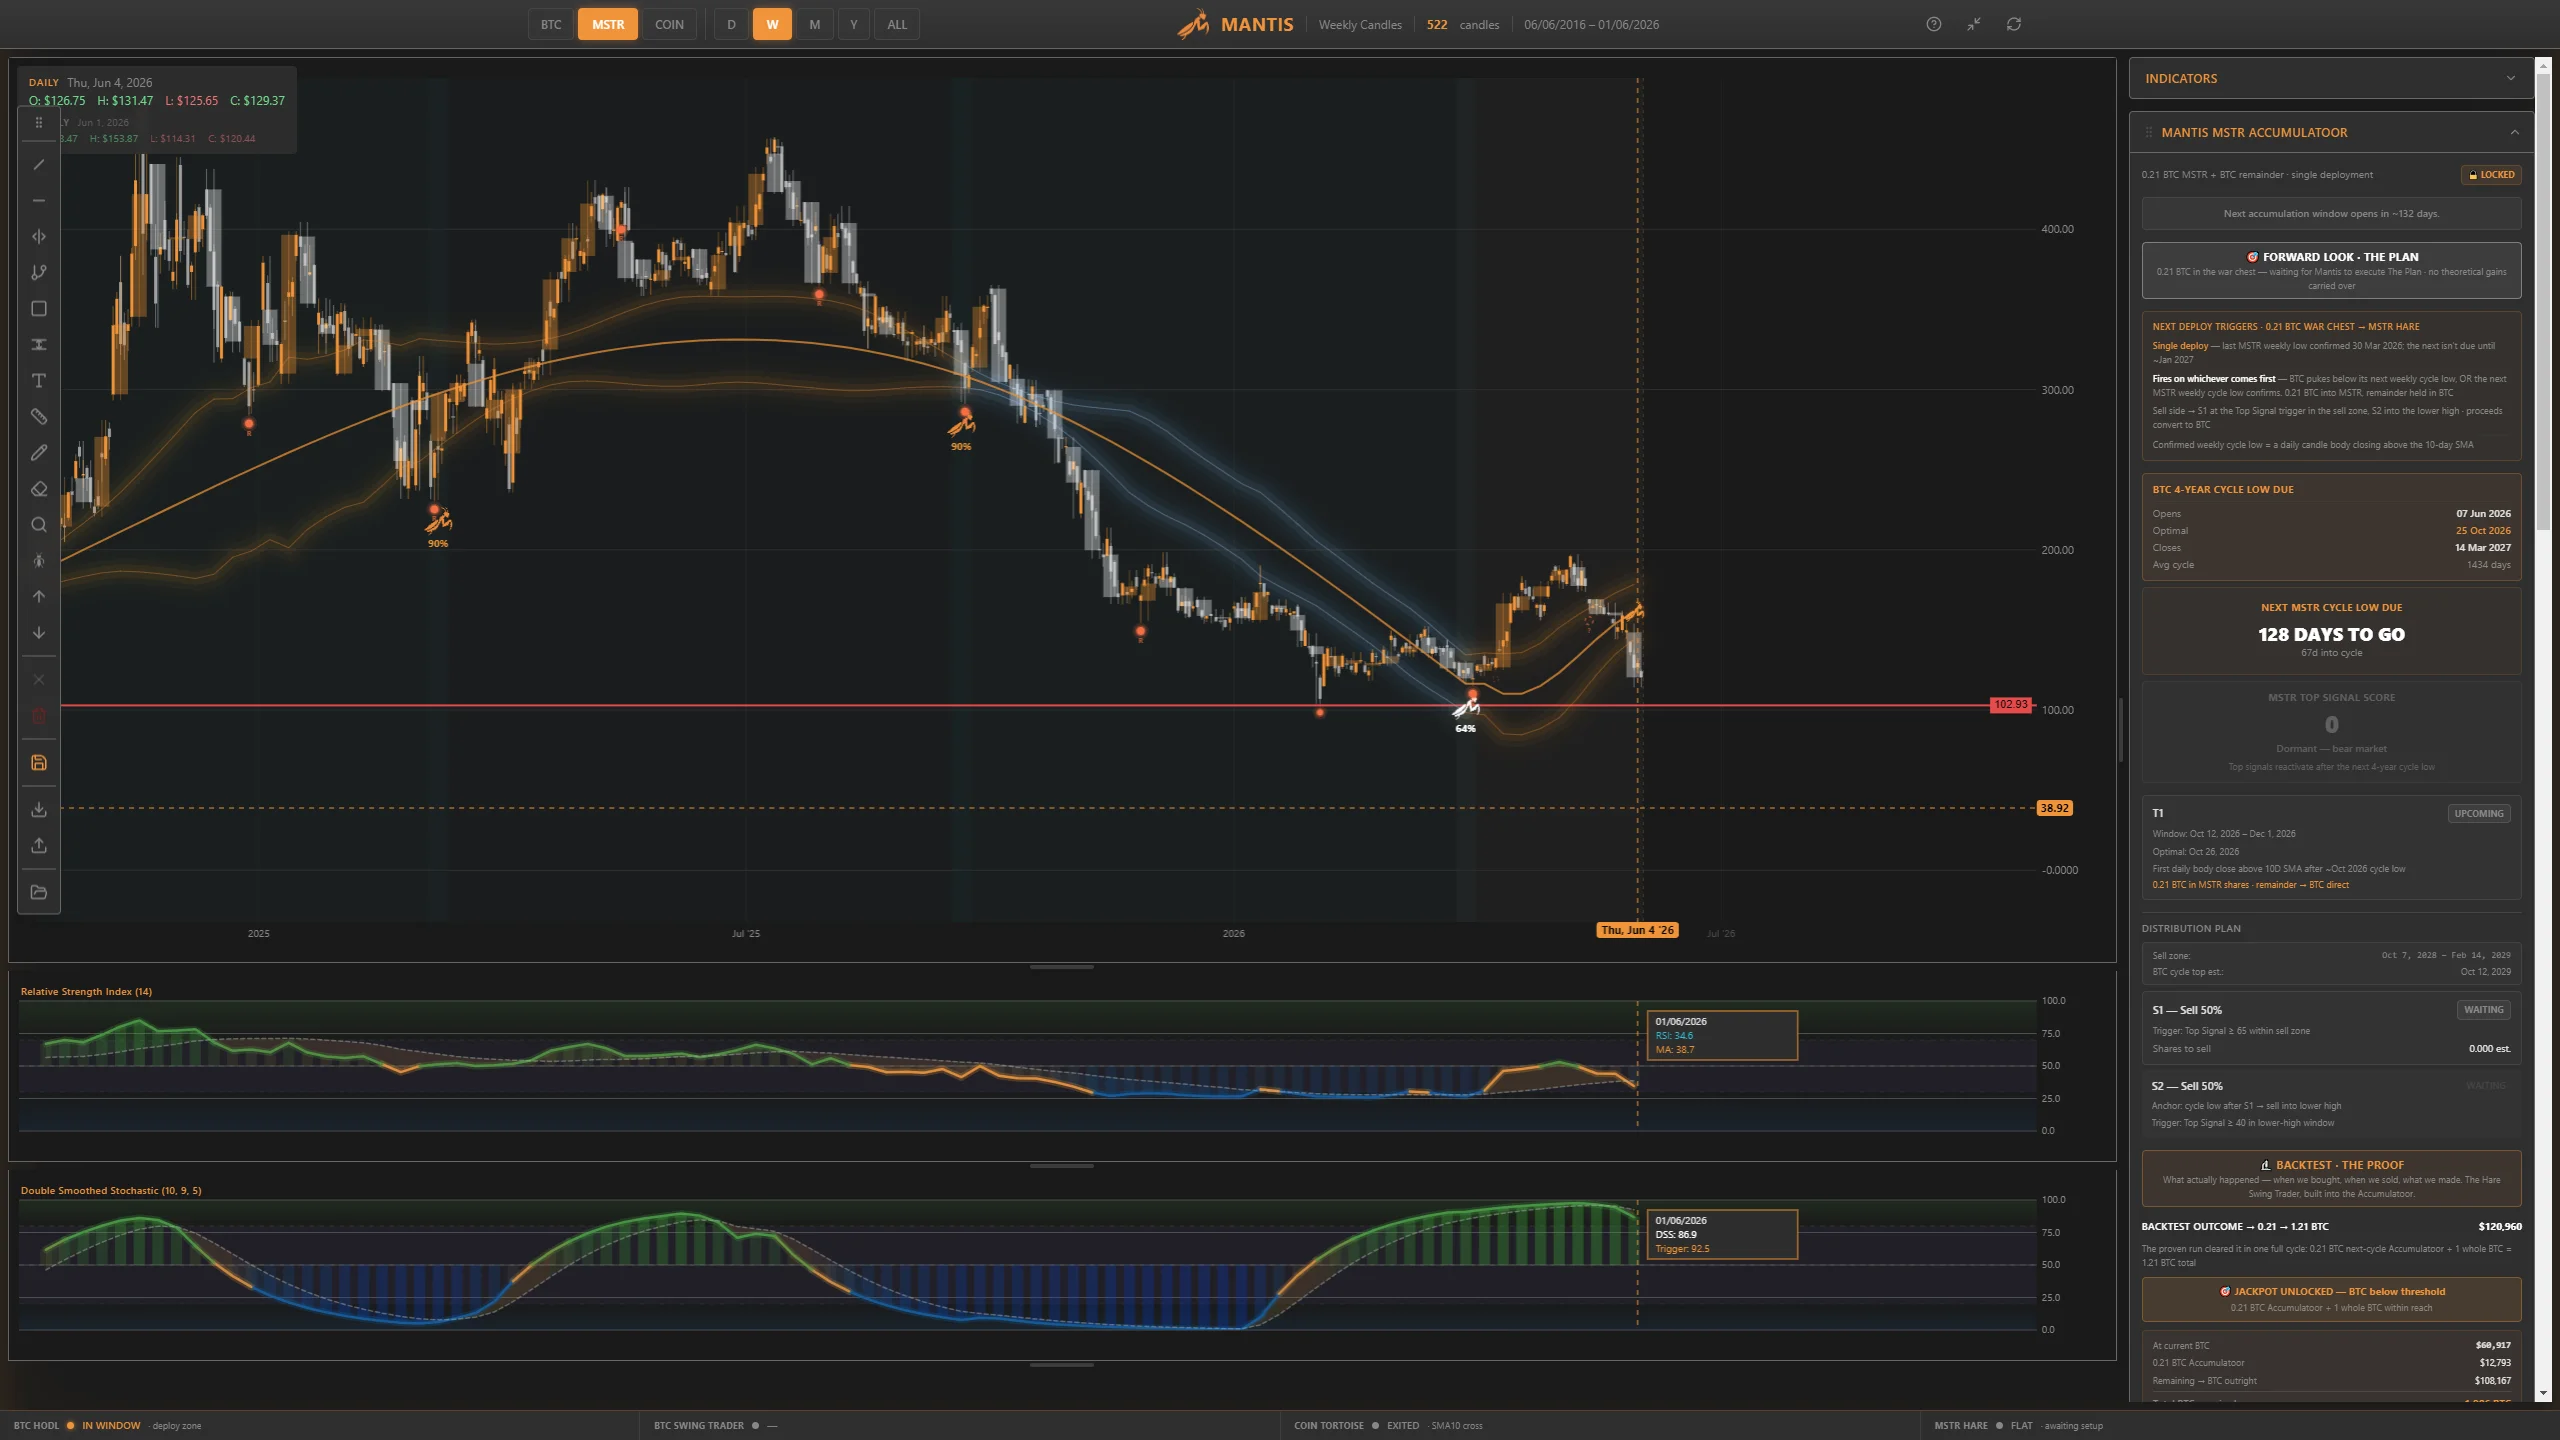
Framework 3 — The MSTR Hare
MSTR is not Bitcoin. It is a Bitcoin-correlated equity with its own weekly cycle, its own risk profile, and significantly higher volatility than BTC itself. The drawdowns during bear markets have historically been severe. This framework is not suitable for all risk appetites and carries substantial additional risk beyond Bitcoin alone.
The MSTR Hare studies one specific subset of MSTR’s historical cycle behaviour: the fast, left-translated parabolic rallies that have historically peaked before the cycle midpoint. These are not the majority of cycles — they are the minority. The framework sits out everything else.
The classifier is the core of this framework. Every MSTR weekly cycle, a six-component Parabola Score analyses velocity, price extension, RSI extremes, volume surge, acceleration, and BTC 4-year phase. By week 7, the model commits to a verdict: PARABOLA, GRINDER, or DEVELOPING. The backtest only models entries on confirmed PARABOLA cycles.
The backtest studies a partial exit approach early in the move, locking in a substantial return on a portion of the position, then models a trailing stop on the remainder. A bear market sit-out condition is modelled after defensive exits — the framework does not re-engage until the classifier identifies a fresh committed PARABOLA.
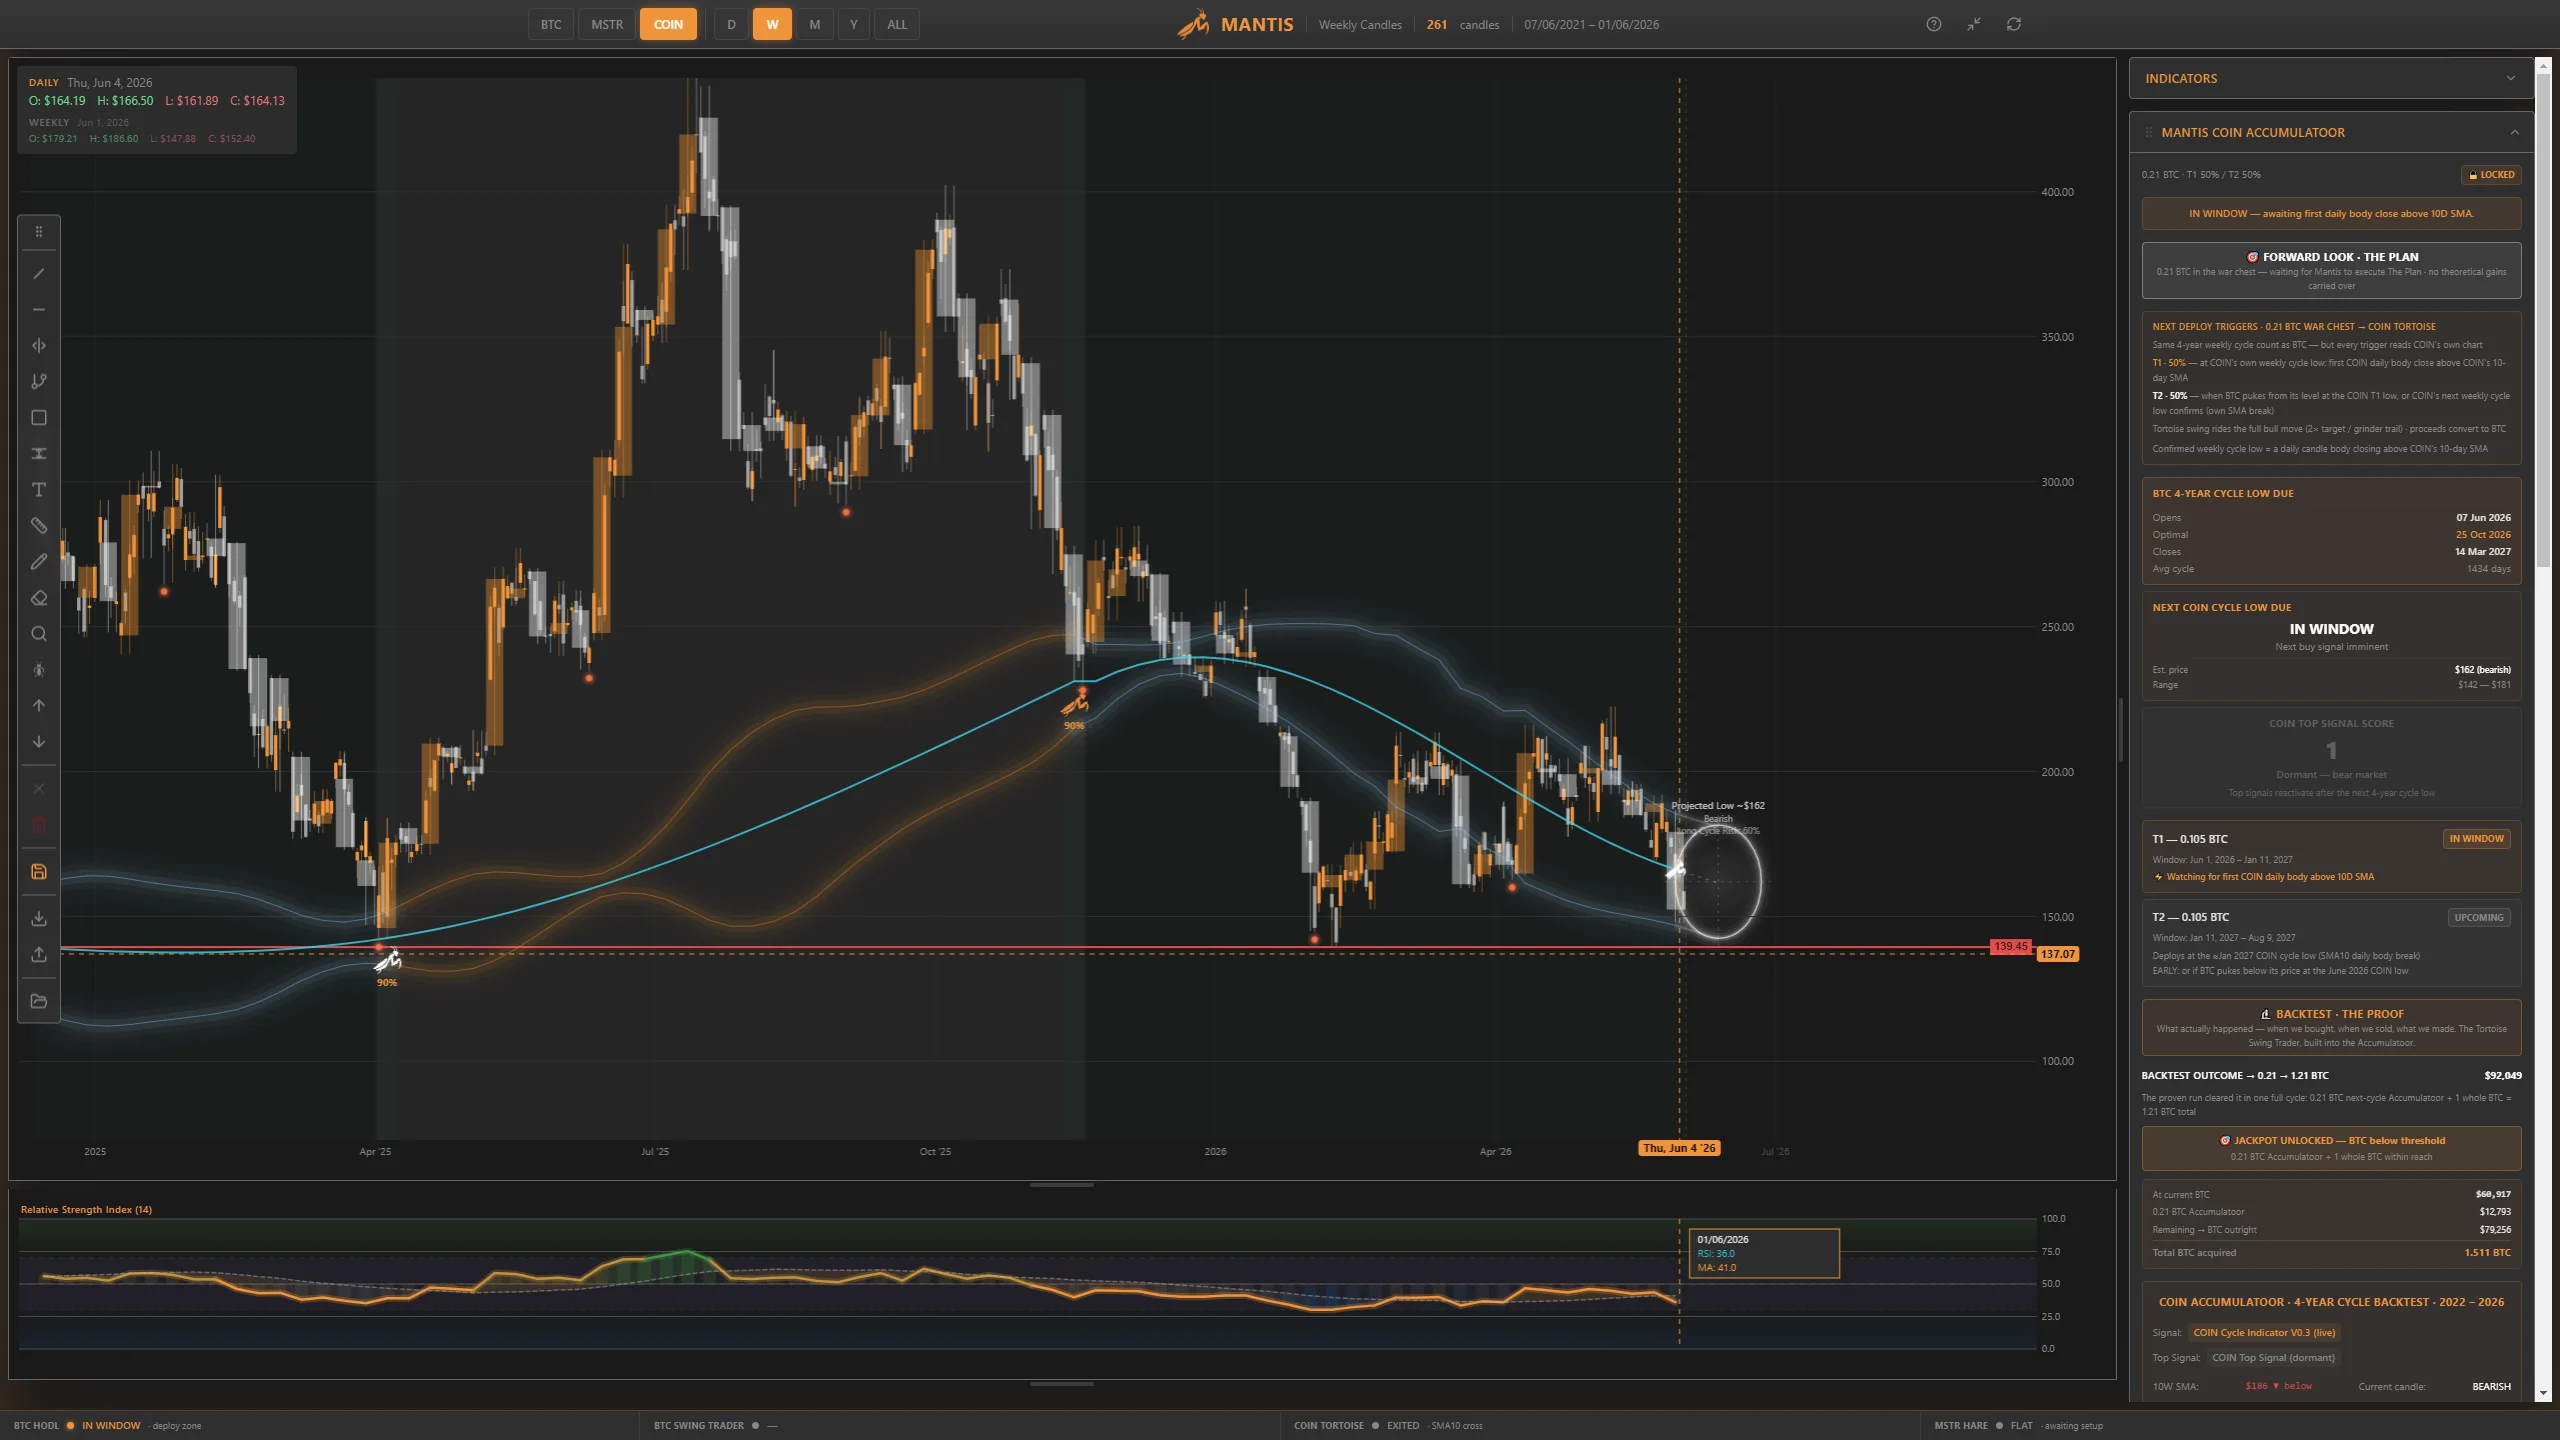
Framework 4 — The COIN Tortoise
Coinbase ($COIN) is a Bitcoin-correlated equity whose own weekly cycle behaviour has been worth studying independently. It is not Bitcoin, and it carries its own equity-specific risks alongside the volatility of the broader crypto market.
The COIN Tortoise classifies each COIN weekly cycle — PARABOLA or GRINDER — using a similar classification engine to the Hare. The backtest studies a partial exit approach early in the move, then models a trailing stop on the remainder, regardless of which cycle type was identified.
4-year top sit-out condition: once the COIN Top Signal confirms the 4-year cycle top — using COIN’s own momentum, RSI, and timing data — the framework models a pause on new entries. Re-engagement is only studied once Bitcoin confirms its own cycle bottom.
The Tortoise name reflects the historical character of the framework: not the fastest possible route, but a systematic, disciplined approach that studies entries at confirmed lows and models exits with a trailing mechanism rather than a fixed target.
How the four frameworks fit together
These are not four separate products. They are four complementary historical study tools built around the same cycle framework, the same reference allocation, and the same long-term question.
The BTC Accumulatoor studies the foundational 4-year cycle entry — the macro low, two-tranche approach, long-term hold.
The BTC Swing Trader studies the active layer — modelling entries at every weekly cycle low through the bull and examining how different trailing exit approaches have historically performed.
The MSTR Hare studies the high-volatility subset — specifically the parabolic MSTR cycle type and what the historical data shows about concentrated, short-duration entries.
The COIN Tortoise studies COIN’s own cycle systematically — modelling partial exits and trailing stops across both cycle types, with a top-signal sit-out condition.
Together they represent a structured historical study of the question: how might disciplined, cycle-aware accumulation across these assets have compounded across previous cycles? MANTIS provides the tools to explore that question yourself, with your own parameters, against the same historical data we use.
What MANTIS v0.3.3 looks like today
All four framework cockpits are live in the current build. Each shows cycle status, historical backtest results, modelled entry and exit conditions, and a trade ledger of how the backtest played out across previous cycles. The bottom status bar gives a persistent at-a-glance read across all four frameworks regardless of which asset tab is active.
Three assets are fully supported: BTC, MSTR, and COIN — each with their own cycle indicator, weekly cycle low detection, curveball risk assessment, forward projection ellipse, and framework cockpit.
The 4-year accumulation window for Bitcoin opened in June 2026. The frameworks are running. The historical data is available to study in real time.
A note on receipts
Every cycle call MANTIS makes is timestamped and public. The March 2026 post noting the weekly cycle low window and the 200-week MA target as a reference level is still there. The window opened in June 2026 and the 200-week MA was tagged.
We will publish the live results of these frameworks as the cycle plays out — not before. Backtests are useful for understanding historical behaviour. Live results are what matter. When the first full cycles have closed, the numbers will be public.
Until then, MANTIS is available as a one-time purchase and gives you access to all four framework cockpits, the full historical backtest data, and the live cycle indicators — so you can study the same data and draw your own conclusions.
This article is for educational and informational purposes only. Nothing here constitutes financial advice or a recommendation to buy or sell any asset. All investment decisions are solely your own responsibility.
Stay patient. Stay focused. Be the mantis.