MSTR Weekly Cycle System — What We Built, Why It Matters, and What's Coming
MicroStrategy ($MSTR) is the most talked-about Bitcoin proxy on the market. Strategy now holds over 750,000 BTC on its balance sheet, Michael Saylor is the most vocal bull in the space, and the stock amplifies every BTC move.
But here’s the thing almost nobody does properly: MSTR doesn’t follow BTC’s cycle timing. It generally leads on the way up, then leads on the way down. If MSTR leads at inflection points, it should also bottom earlier. And if it has a regular weekly cycle, that bottom is predictable.
So I built the system to find it.
The Problem With Copying BTC Playbooks Onto MSTR
Every cycle BTC goes through, MSTR amplifies it. The drawdowns are deeper, the recoveries more violent. The standard playbook — buy BTC, wait for the cycle, sell near the top — doesn’t translate cleanly because the timing is different.
MSTR tends to peak before BTC and bottom before BTC. That means using BTC cycle windows for MSTR entries will consistently get you in late on the way down and early on the way up. You need MSTR-specific cycle analysis.
MSTR doesn’t follow BTC’s cycle timing. It leads. The bottom is predictable if you’re looking at the right clock.
What Got Built
The Cycle Count
Starting from January 2020, I mapped every MSTR weekly cycle low manually. The result was striking — every confirmed low fell within the same timing window as BTC. The same cadence. The same structural rhythm.
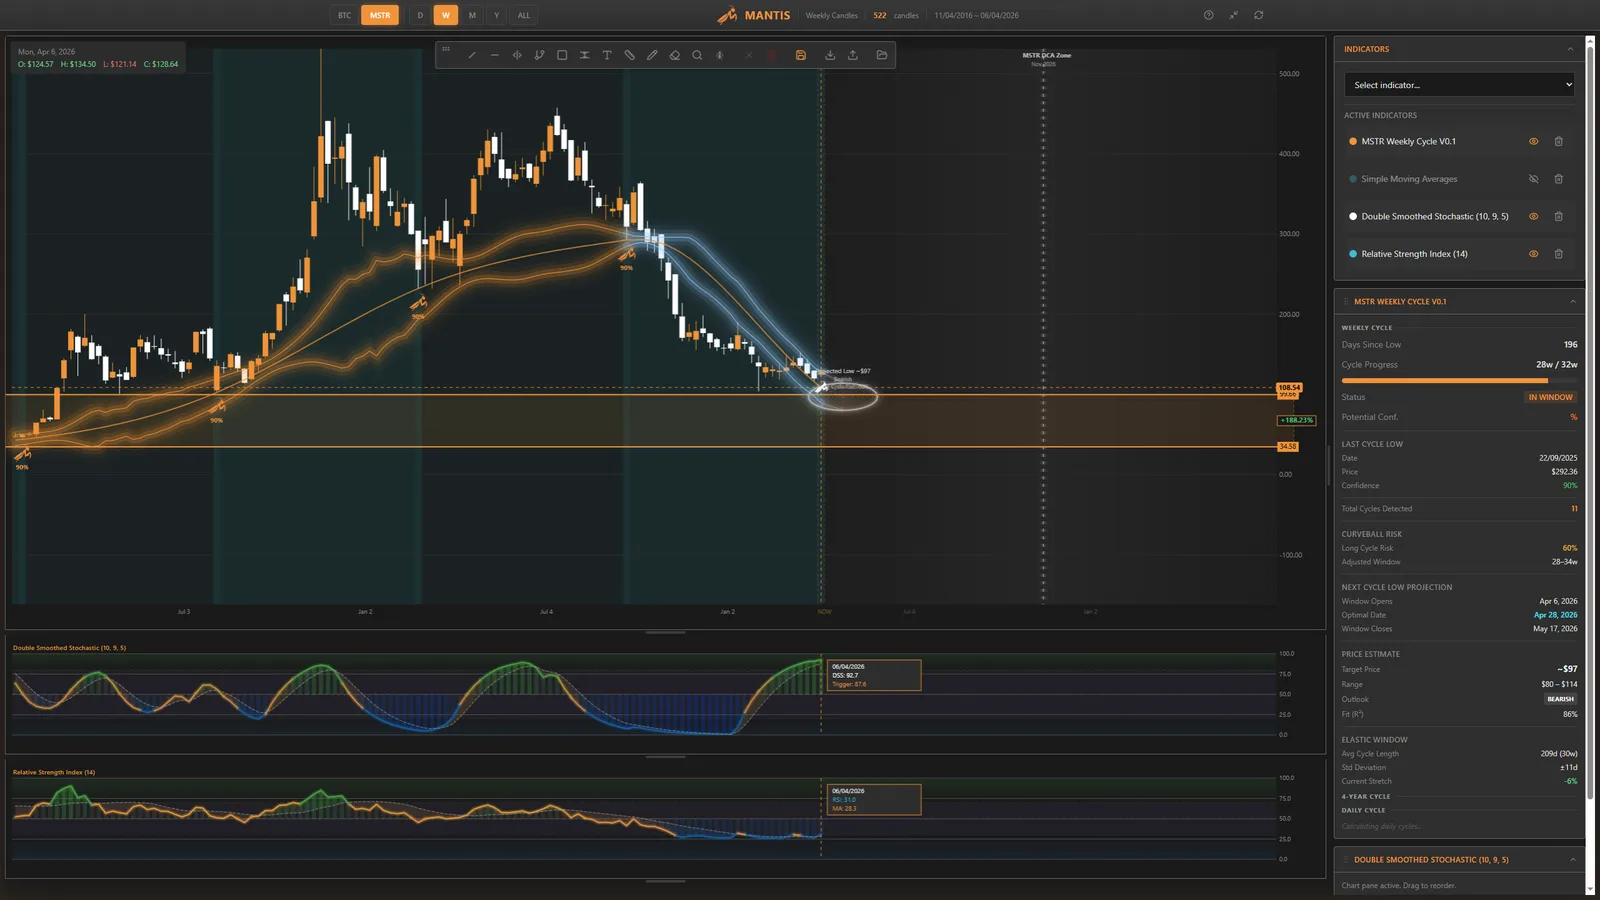
The current projection window opened April 6, 2026. We are live inside it right now. Mantis is now operating autonomously — watching the data, scoring the setup, waiting for the weight of evidence to say now.
The MSTR Weekly Cycle Indicator (V0.1)
The centrepiece. A full port of the Mantis Bitcoin Weekly Cycle Indicator, adapted for MSTR’s specific characteristics.
What it does:
- Plots confirmed historical cycle lows on the MSTR chart with markers and labels
- Renders a live projection ellipse centred on the estimated next low — with price and date range
- Scores the current setup using a 5-skill confidence system
- Calculates a curveball risk adjustment that shifts the projected optimal date based on macro and structural factors
The ellipse isn’t just decorative. It encodes both the time range and the expected price range of the next low. When the setup is bearish, the system adjusts the projected price and shifts the centre of the window accordingly.
The Asset Switcher
To make MSTR a first-class citizen alongside BTC, a full per-asset architecture was built into Mantis:
- BTC / MSTR tabs in the control bar — switches the entire charting context
- Per-asset indicator persistence — your MSTR indicators stay put when you flip to BTC and back
- Yahoo Finance API integration — pulls 10 years of MSTR daily OHLCV data, aggregated to weekly and cached locally
- Plugin filtering — the indicator panel only shows plugins compatible with the currently selected asset
The architecture is designed to extend cleanly. Adding MARA, RIOT, or CLSK as future assets means one new plugin file, one new tab entry, two lines in the registry. That’s it.
The MSTR Accumulatoor
The cycle indicator tells you when the low might arrive. The Accumulatoor tells you how to deploy capital when it does — and removes the emotion from the decision entirely.
The strategy:
- $60k war chest
- 4 tranches × 25% — one per cycle low
- T1–T3: Deploy at the confirmed cycle low within each window
- T4: Gated — only deploys after the first green candle that closes above the 10-week SMA within the T4 window. By this point, the macro bottom should be confirmed.
Right now, T1 is IN WINDOW. The system is watching. When it sees a confirmed cycle low, it deploys — no second-guessing, no waiting for a better entry that may never come.
The Accumulatoor sidebar shows war chest status, live 10W SMA reading, per-tranche status badges, and a running portfolio summary with average cost basis and P&L estimate.
What Comes Next
MSTR Top Signal (V0.2) — In Progress
This is the sell-side of the system — and arguably the harder problem. MSTR doesn’t top with BTC. It tends to lead BTC at cycle peaks by several months. The November 2024 MSTR top vs. October 2025 BTC top is the clearest example.
The Top Signal will be a scored indicator (0–100, same architecture as the BTC Top Signal) built on three factors:
Factor 1 — Lead-Adjusted BTC Cycle Top Timing. Using the historical average lead time between MSTR and BTC peaks, this projects a MSTR-specific sell window that opens before the BTC weekly cycle top window.
Factor 2 — Price Extension From Last Cycle Low. Every MSTR cycle top has printed after a substantial percentage gain from the preceding cycle low. When MSTR has extended by a threshold multiple, this factor activates.
Factor 3 — Weekly RSI Confirmation. RSI > 75 on the weekly confirms overbought conditions. Without this, the other two factors stay muted — avoiding early exits in strong continuation moves.
The signal will wire directly into the Accumulatoor, replacing the current sell-side placeholder with a live score, sell zone window, and suggested exit schedule.
Further Down the Road
- MSTR Daily Cycle — a daily cycle layer would allow much tighter entry timing within the weekly window
- BTC Beta Basket — MARA, RIOT, CLSK each get their own plugin and asset tab, using MSTR as the template
- Skill 3 (On-Chain Proxy) — institutional holdings data or a BTC on-chain derivative that correlates with MSTR demand. Still researching the right proxy
- MSTR/BTC Ratio Pane — an overlay showing MSTR’s relative strength vs BTC, useful for identifying compression vs. leading behaviour ahead of inflection points
The Part I’m Most Proud Of
Honestly? The curveball risk system.
Most cycle indicators give you a fixed window: “the low is between these dates.” That’s fine, but it ignores everything the market is actually telling you. Three factors are currently signalling that this cycle runs long — BTC Year 4 macro pressure, a structurally lower low suggesting continuing distribution, and the weekly trend still bearish. The system hears that, shifts the optimal projection date accordingly, and renders the ellipse with the centre skewed to match.
When the low prints, the Accumulatoor won’t just trigger mechanically on day one of the window. It’ll wait for the window to deepen, watch the confidence score rise, and deploy when the weight of evidence says now.
That’s not a rigid rule. That’s a framework that thinks.
MANTIS is a professional-grade charting tool built for serious cycle traders. If you want early access or want to follow the development, reach out.