What Hooligan Is, And The Number It's Chasing
This is the first entry in a working notebook, so it’s worth starting with the awkward part.
Hooligan is not for sale. There’s no purchase path and there isn’t going to be one. You can’t buy it, download it, licence it or run it.
Two reasons, and both of them are the real ones. First, some of the mechanics in here are genuinely risky — a thin cohort of volatile assets, held through cycles, on rules that have been tested against a handful of historical counts and nothing else. That’s a reasonable thing to do with a small amount of my own money and an unreasonable thing to hand to somebody else with a licence key attached. Second, it would detract from MANTIS. MANTIS is a Bitcoin instrument with a narrow, defensible job. Selling a speculative altcoin engine alongside it would blur exactly the thing that makes it worth owning.
So this is educational, and it’s published for the same reason anyone shows their working: because writing it down in advance is the only way anyone can tell afterwards whether it worked, or whether the story got tidied up on the way to the conclusion.
Why it exists at all
Two reasons, and the second one is arguably the bigger.
To find out how far the weekly cycle can actually be pushed. MANTIS uses the weekly cycle conservatively and on Bitcoin, where the counts are clean and the stakes are a long-term accumulation. Hooligan asks the other question: what happens if you take the same clock and run it on assets that move four and five times as hard, on counts that have to be transposed and hand-ruled because the history isn’t there? Where does the method hold up, and where does it fall over? You don’t learn that by being careful. You learn it by finding the edge, which means occasionally going over it.
And to learn things worth building with later. There’s more MANTIS to come, and the sensible way to find out whether an idea is worth shipping is to run it somewhere the only person exposed to it being wrong is me. Everything here is R&D. Some of it will turn out to be a real mechanism and end up in a product one day. Most of it won’t, and the log will say so — the failures are the more useful half, and they’re a great deal cheaper to have here than in something people paid for.
The mission
Turn $1,000 into 0.21 of a Bitcoin, bought at the bottom of the next bear market.
That’s the whole thing. One deposit, one cohort, one clock, one conversion at the end.
The number comes from an assumption, stated up front so it can be held against us: that the next bear market bottoms somewhere around this cycle’s all-time high of roughly $126,000. If that’s where it lands, then 0.21 of a Bitcoin costs $26,460 — and getting there from $1,000 means 26.5x in dollars.
It does not require beating Bitcoin
This is the single most important thing about the mission, and it’s the reason this version is attemptable where an earlier framing wasn’t.
We spent a while on “$1,000 into one whole coin.” That needed roughly 64x in Bitcoin terms — you’d have to comprehensively out-run the asset you’re trying to accumulate, for years. That’s a tail outcome, not a plan.
This version is different in kind, not degree. It’s denominated in dollars right up until the final conversion. Make dollars during the alt cycle, then buy cheap Bitcoin in the bear. You never have to beat Bitcoin. You have to make dollars while Bitcoin is expensive and spend them while it’s cheap. Different problem, different difficulty class.
For scale: the assets we studied, run from the 2022 four-year low to their peaks, would have cleared that on the first leg alone. Which sounds comfortable and isn’t — those runs assume perfect exits nobody actually gets. The slack is deliberate. This is built to survive being executed imperfectly, because it will be.
The inversion — a shallow bear market hurts us
Here’s the part that runs against every instinct, and it’s why the plan is being published now rather than in 2030.
We are a buyer at the end of this. That flips everything:
| If the next bottom is | 0.21 BTC costs | Multiple needed |
|---|---|---|
| $55,000 | $11,642 | 12x |
| $126,000 | $26,460 | 26x |
| $150,000 | $31,500 | 32x |
A deep bear is good news for this mission. A shallow one is a problem. In 2030 every timeline you follow will be saying the opposite, at volume, and that’s precisely when this table stops being an abstraction. It goes on the record now so it’s obviously a plan written in advance rather than a rationalisation assembled afterwards.
On the $126,000 assumption itself: bear lows have been landing at a higher share of the previous all-time high every cycle — the drawdowns are getting shallower as the asset matures. Extend that trend and $126,000 is roughly where the next one lands. It implies a 2029 top a little over double this cycle’s, which is a smaller step up than the last cycle managed. Neither heroic nor conservative. Just the trend, continued.
Where this sits next to MANTIS
MANTIS is 0.21 BTC → 1 whole coin. Hooligan is $1,000 → 0.21 BTC.
Same staircase, one rung lower. Hooligan is how you get to the starting line — aimed squarely at the person who reads the wholecoiner material and thinks “I don’t have 0.21 to begin with.”
That’s why the two missions rhyme rather than compete, and it’s the only good reason to run this one in public at all.
How it actually works
Trade riskier crypto against the Bitcoin weekly-cycle clock, compound across cycles, and roll the gains down a risk gradient as the cycle matures — out to cash at the top, and into Bitcoin at the bottom.
Five stages, one clock:
- Buy early runners near the four-year low
- Compound through weekly cycles
- Rotate into later-topping assets as each early name rolls over
- Exit to cash at Bitcoin’s top — and stay in cash
- Buy Bitcoin at the next four-year low
The clock is Bitcoin’s weekly cycle throughout — for entries, for exits, and for the rotation.
Stage four is cash, not Bitcoin, and the distinction is the whole plan. Exiting into Bitcoin at Bitcoin’s top would mean buying at the most expensive moment of the cycle and then riding it down through the drawdown we are explicitly waiting for. We don’t want Bitcoin at the top. We want the dollars we made on the way up, held through the bear, and spent at the bottom. There is exactly one conversion in this plan and it happens at the end.
The gradient is real, and it’s ordered
Looking at the last cycle, the assets sort themselves without us imposing anything:
INJ / RENDER   topped Mar 2024      −90%
XRP            topped ~Jul 2025     −70%
BNB            topped ~Oct/Nov 2025 −58%
The earlier an asset tops, the harder it falls. Three independent points on a clean line. INJ and RENDER both topped in March 2024 — different sectors, different narratives, same month, which happened to be Bitcoin’s first major high of the cycle at around $73,000. Neither participated in the leg from $73,000 to $126,000. They simply never came back.
So the rotation does two jobs at once: it captures sequential pumps and it de-risks on a schedule.
One rule for every rotation
Not “has it topped?” — that’s hard, it’s late, and it looks different on every asset. Instead:
Is it still outperforming Bitcoin? Hold while the Bitcoin-denominated trend is up. Rotate when it isn’t.
One mechanism, no buckets decided in advance, and it tells you when the rotation is finished — because once nothing outperforms Bitcoin, there is nothing left to rotate into. That’s the signal to step out to cash and wait, not to buy Bitcoin with the proceeds.
That last point matters more than it sounds. From Bitcoin’s top: BTC −49%, BNB −58%, XRP −70%. Everything fell. Bitcoin merely fell least — which makes the later names a staging post rather than a destination, and makes Bitcoin itself no place to be sitting either. Holding anything through that is the mistake; the only asset that doesn’t fall in a bear market is the one you haven’t bought yet. It’s the same lesson the miners taught us in reverse — up 228% in dollars, and still a loss measured in Bitcoin, because the exit was never planned.
The cohort, as it stands today
Seven assets. Five tradeable — FET, INJ, RENDER, PUMP and VIRTUAL — plus XRP and BNB, which are marked analysis-only and exist as rotation targets rather than entries.
Three of them are veterans in the sense that matters here: INJ, FET and RENDER have been through a full cycle, so there’s history to rule a count against and a rule to test. The other two haven’t, and that’s a real limitation rather than a detail.
Every one of the seven is currently sitting in cash, awaiting deployment. Nothing has been bought.
The descending trendlines have broken on all three veterans, and it’s worth being blunt about what that is and isn’t. A trendline break is not a buy signal here. It isn’t the trigger, it isn’t part of the rule, and nothing gets deployed on the strength of one. The trigger is a confirmed weekly cycle low on that asset — and none of the three has one yet. The breaks are context, and context is not permission.
So the charts below are the instrument doing its work. Not positions, not calls, and not entries. Each cycle low confirmation, as and when it arrives, gets published here — with its timestamp, and with the commit that predates it.
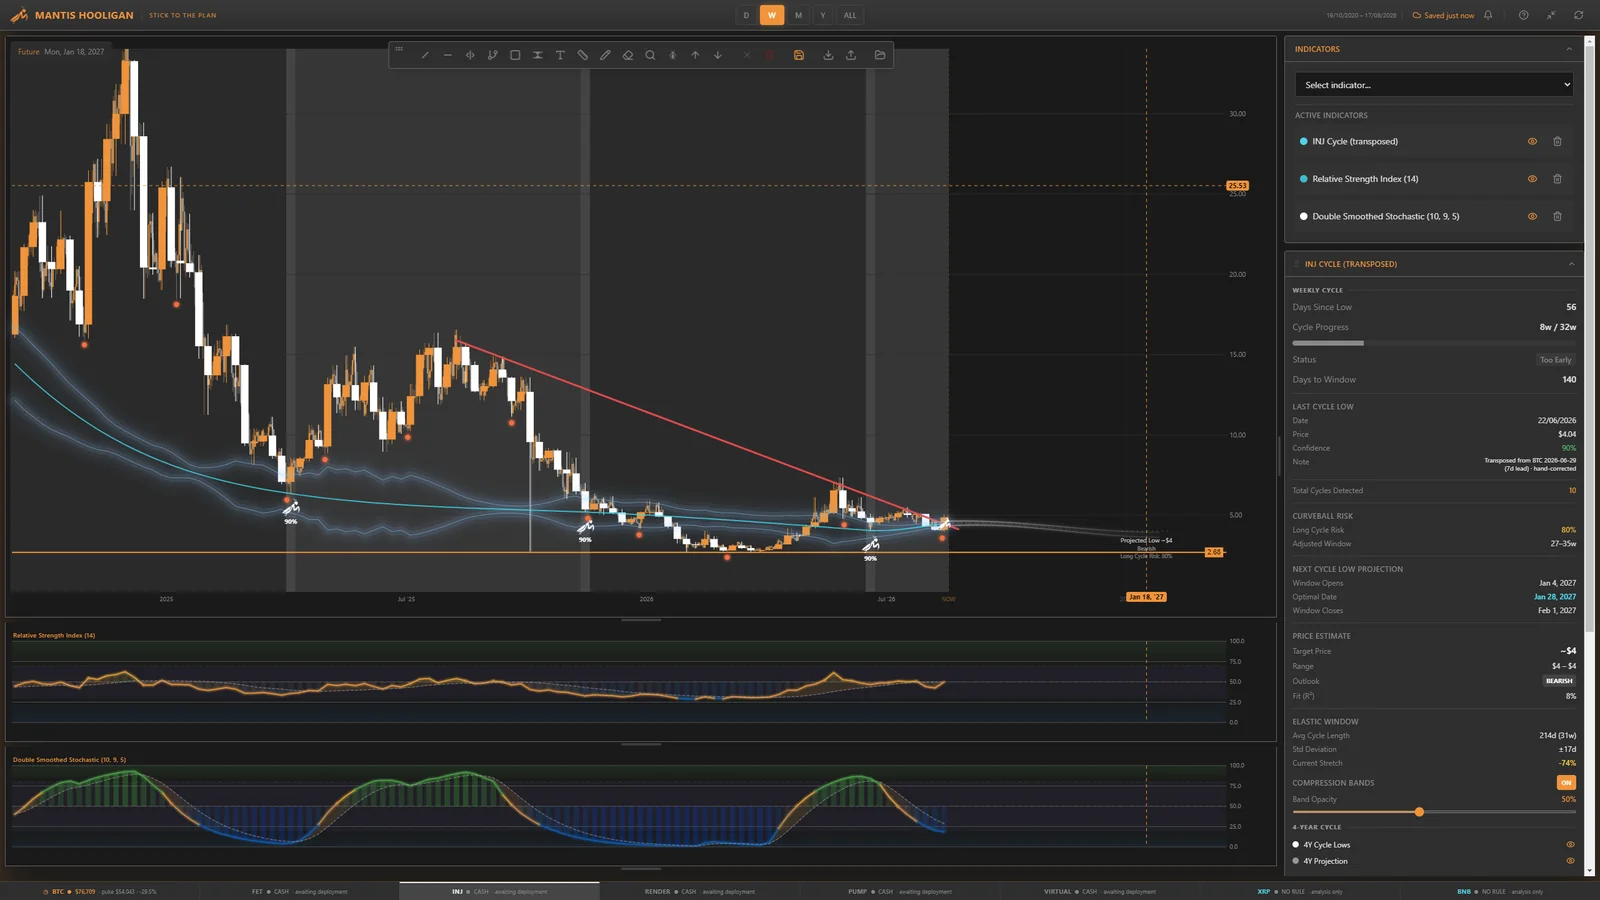
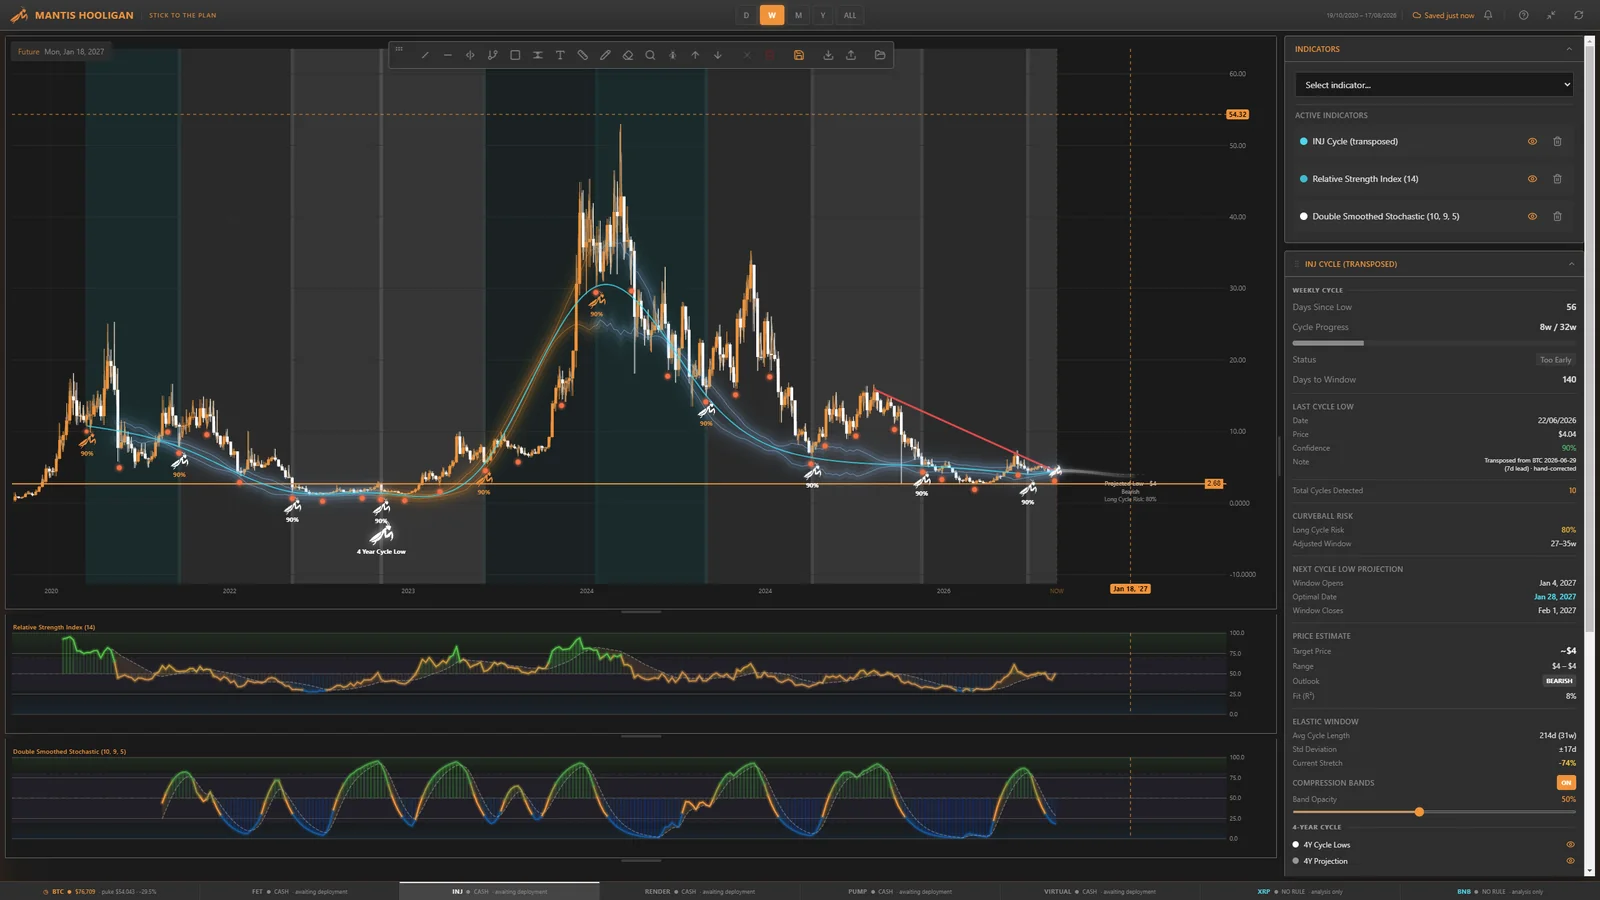
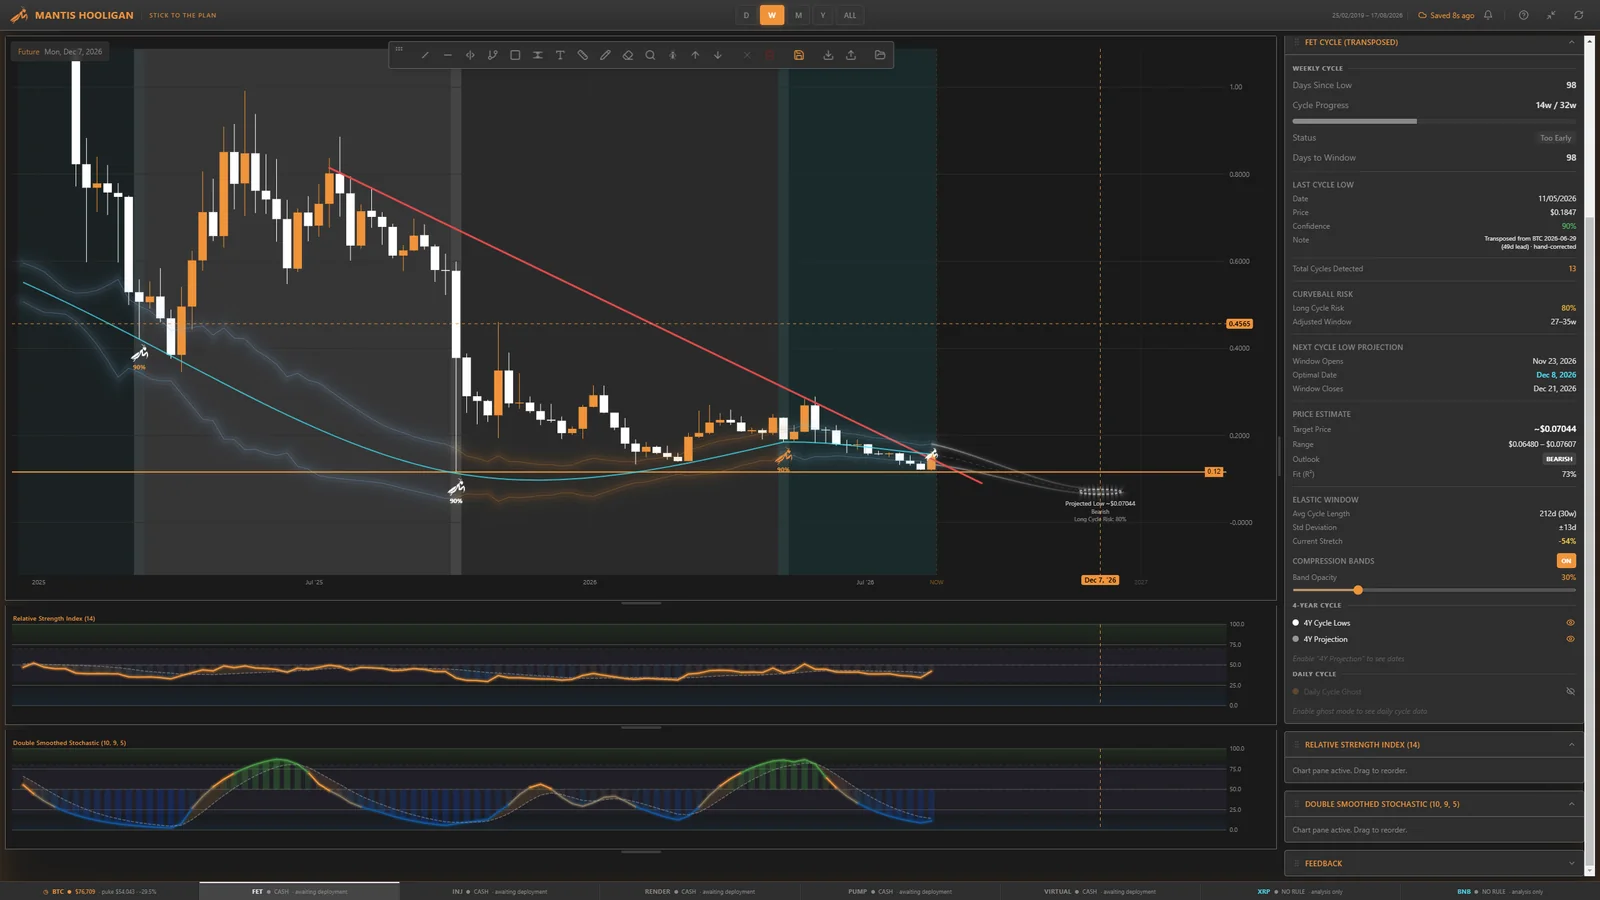
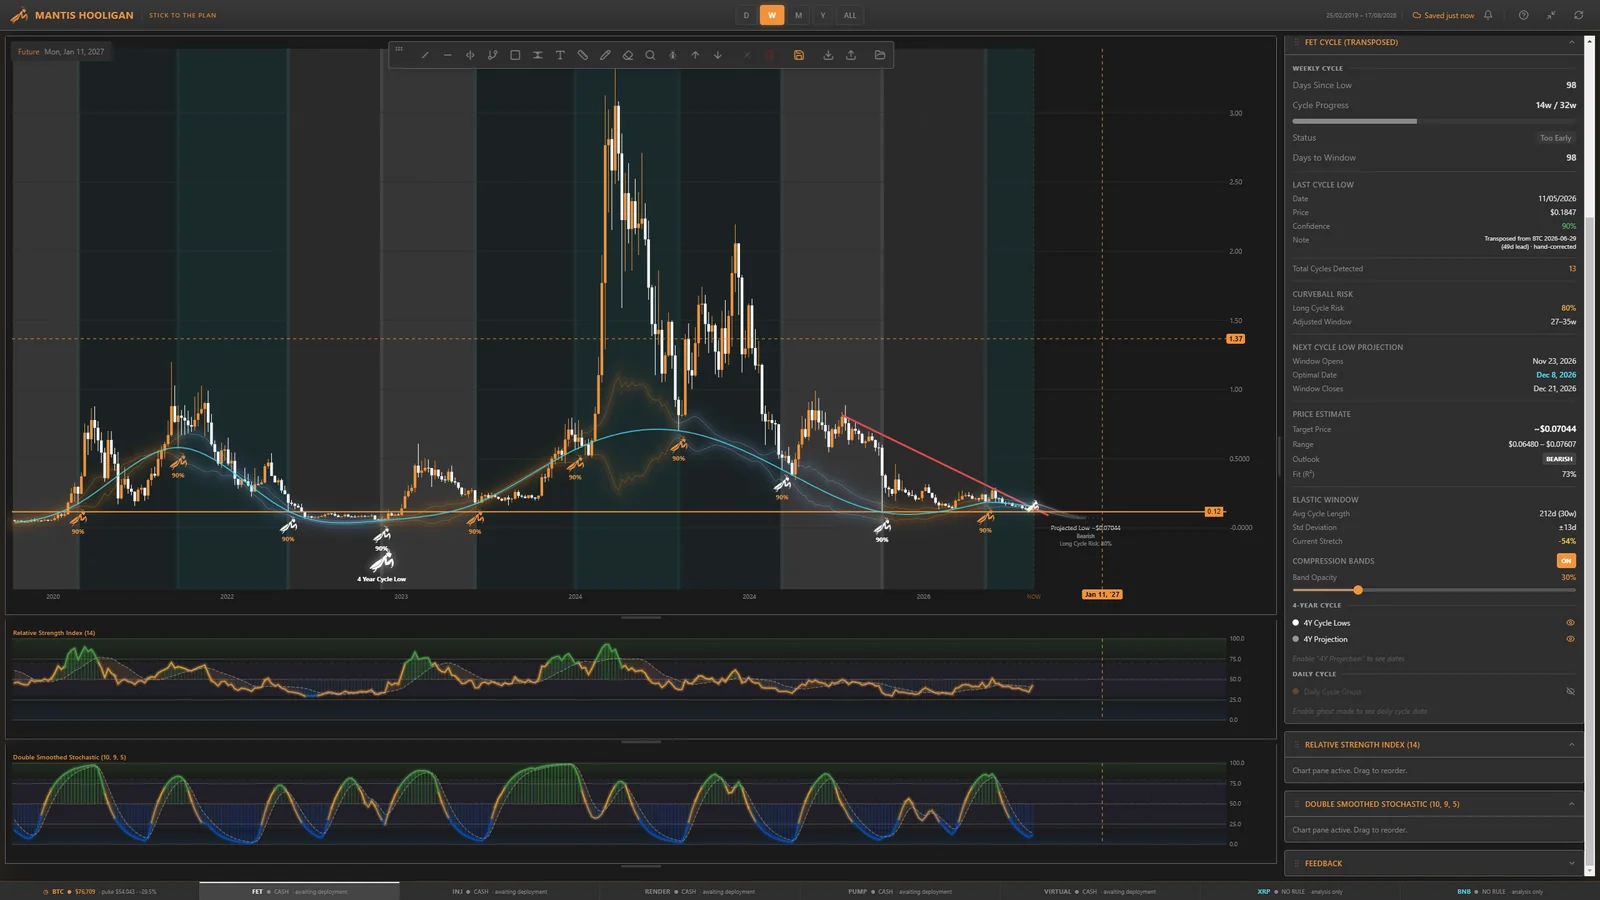
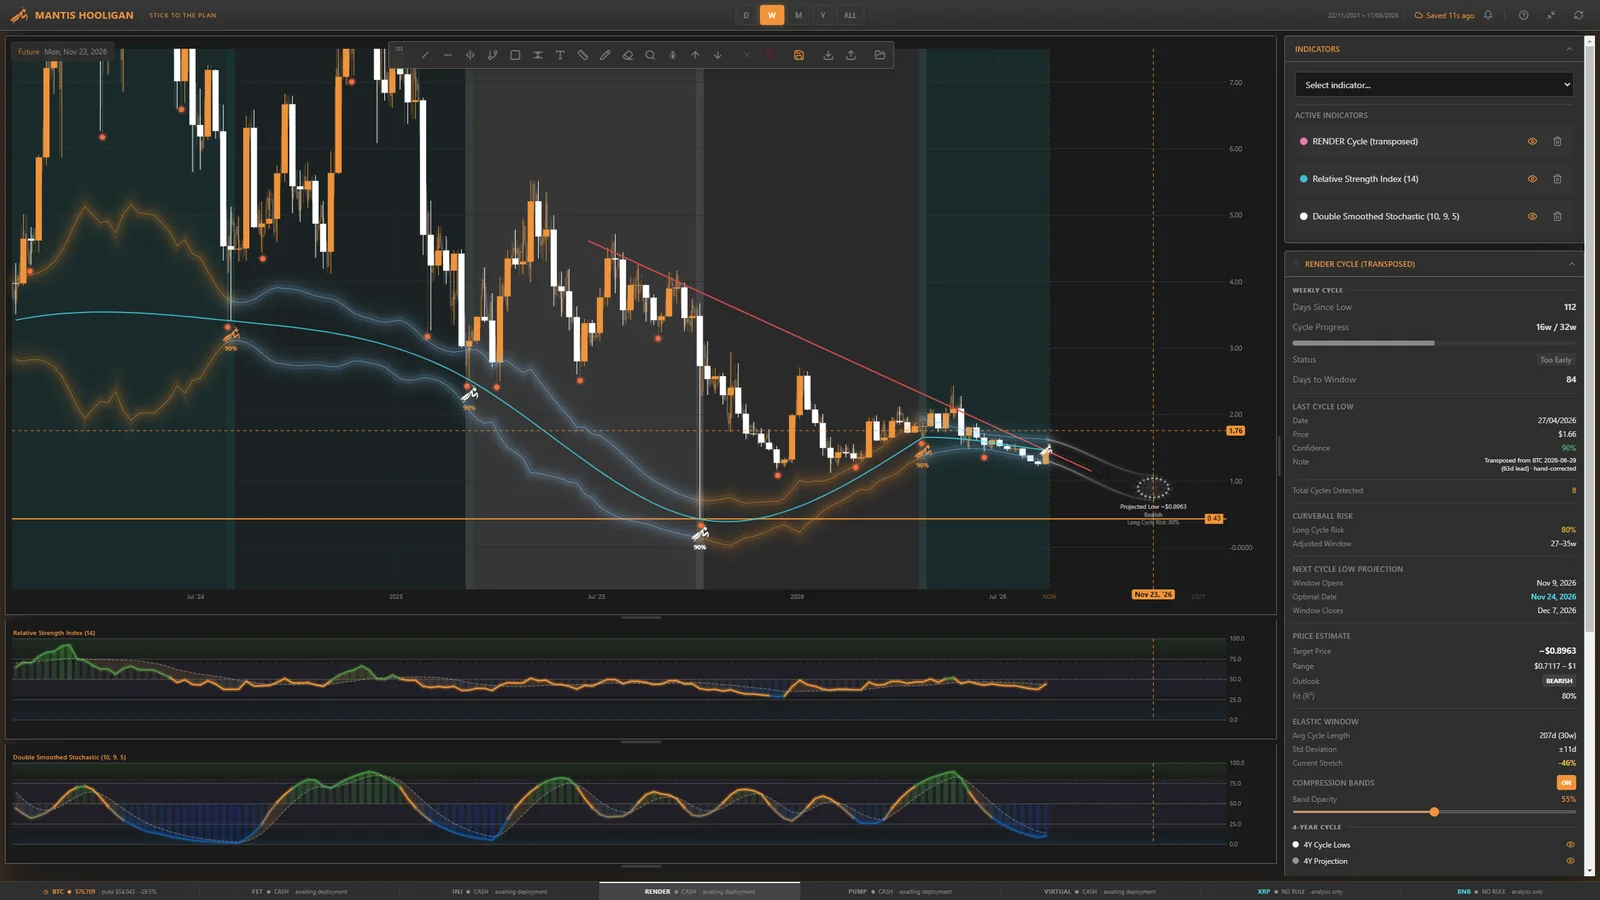
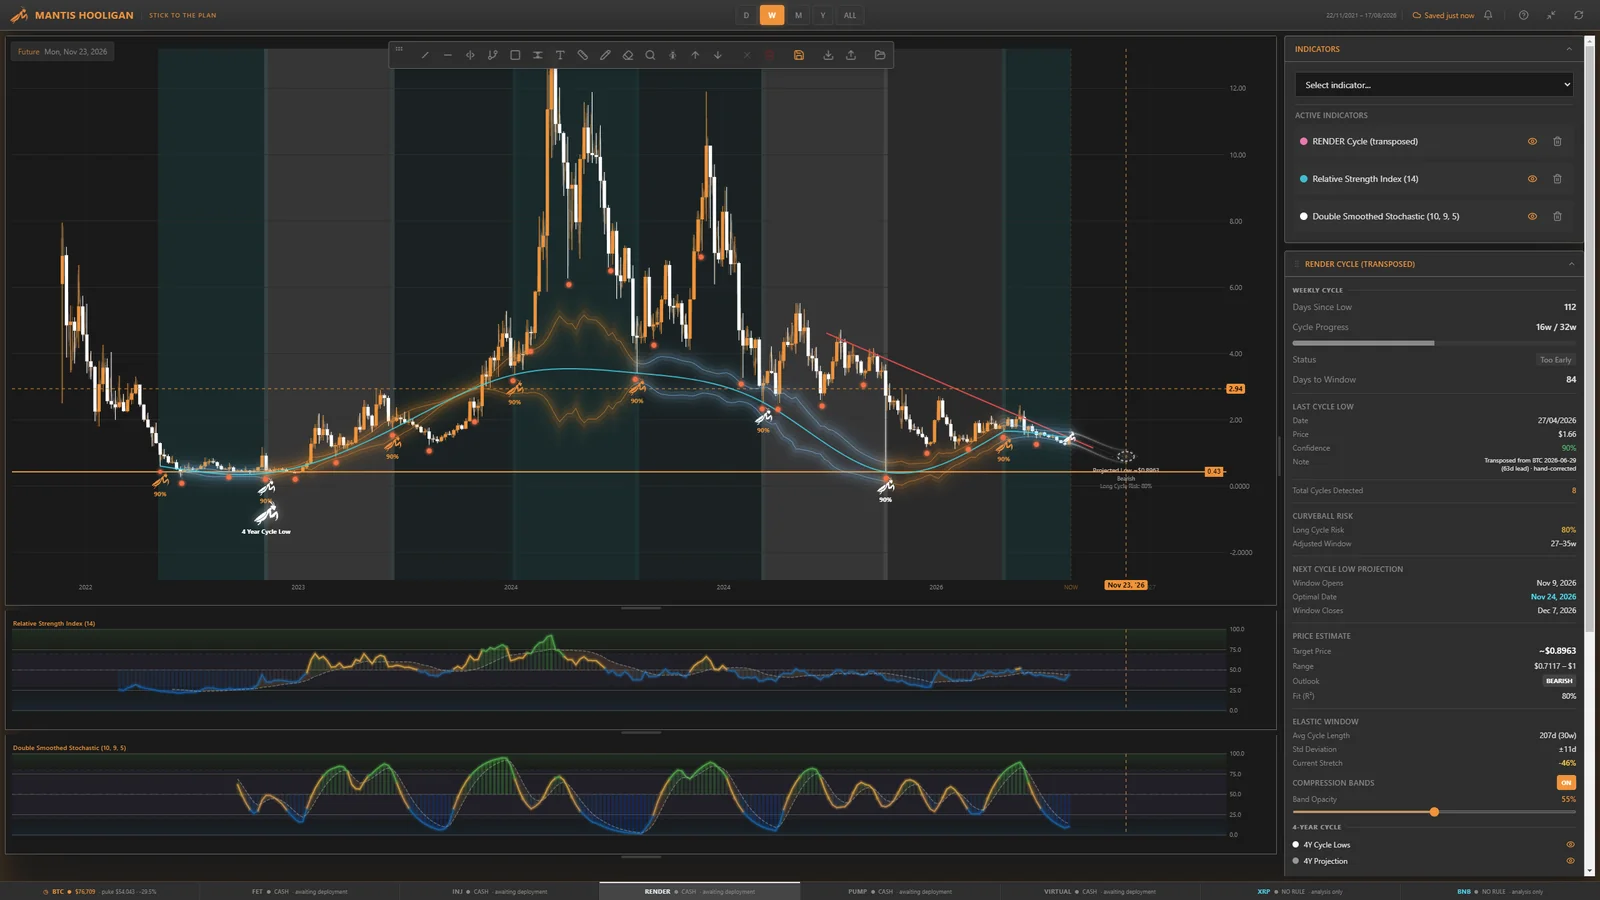
You’ll notice the cycle counts are marked transposed and hand-corrected. These assets don’t have clean cycle histories of their own, so the count is carried across from Bitcoin’s and then ruled by eye against the chart. That’s a judgement call sitting inside the machinery, and it’s flagged in the panel rather than hidden — because it’s exactly the sort of thing that should be visible when it later turns out to be wrong.
Where this is going
That hand-ruling is the thing we’re trying to make unnecessary. Two aims sit behind the whole exercise.
An autonomous engine that can survive assets like these. FET, INJ and RENDER do not behave like Bitcoin. They gap, they wick, they run several hundred percent and then hand back ninety. A rule tuned on Bitcoin’s comparatively civilised volatility gets taken apart by them — which is precisely why they’re the test bed rather than something gentler. If a mechanism holds up here it will hold up anywhere; if it falls over, far better to find that out on this cohort than on something people paid for.
And a MANTIS that reads its own conditions. Today the counts are hand-ruled, and the interesting judgements — is this cycle running long, is it inverting, is this a market-wide event rather than a cycle event — are made by a person looking at a chart. Some groundwork is already in: the tool scores the risk of a cycle running short or long, and it had that risk elevated before June’s lower low printed. But it flags. It doesn’t yet conclude.
The aim, as this bull market develops, is that it starts to conclude. That it can tell a cycle inversion from a cycle failure. That it can identify a short cycle or a stretched one while it is happening rather than in hindsight. And that it can recognise when something has arrived from outside the cycle altogether — the Yen carry unwind of August 2024 being the obvious case, a violent flush that had nothing to do with where Bitcoin sat in its own rhythm, and which no amount of cycle counting would have seen coming.
That last one is the hardest and almost certainly the furthest away. A tool that knows the difference between the cycle did this and the world did this is worth a great deal more than one that only understands the first. Whether we get there is genuinely open — which is why it’s written down here, in the workshop, rather than promised on the product page.
What’s been learned so far — and what none of it proves
Each veteran ended up with a rule of its own, tested against hand-ruled cycle counts back to the 2022 low. I’m not going to put the multiples on this page. They’re flattering, they’re the sort of number that gets screenshotted without its caveats, and the caveats are bigger than the numbers.
Here’s what actually matters about them.
They are the best cycles by construction. These are the bull run out of a bear low. They exclude the collapses that followed — and in one case that’s a −91% drawdown sitting just outside the window.
The scope was chosen knowing where the top was. “Stop after three cycles” is easy to say when you already know March 2024 was the peak. Live, that decision needs a rule of its own, and the tests don’t contain one. That is the single biggest gap between this and a system anybody could actually run.
The three rules are not one principle. Each was found on one asset, and each works differently. Three separate findings that happen to point the same way is not a law, and writing them up as one would be the exact mistake this log exists to avoid.
What the three do have in common isn’t a number — it’s that every one of them exits before the drama. They sell into strength and leave money on the table, every time. The capture rates look modest against perfect hindsight precisely because perfect hindsight requires holding through moves nobody actually holds through.
Two lessons that generalise, and cost the most to learn:
A move measured off a chart is not a move you can trade. A chart box measures wick to wick; a real target measures the price you got in at to the price you got out at. The gap between the two is enormous — call it two-fifths of the move, gone before your entry even confirms. A wick is not an entry.
The penalty for reaching too far is a cliff, not a slope. Nudging a target slightly beyond what the cycle will actually deliver doesn’t cost you slightly less. It costs you most of the run, in one step, with no warning on the approach. Greed is safe on a slope and lethal near a cliff — and you cannot tell which one you’re standing on without testing it.
The rules of this log
Every entry and every exit gets published with its timestamp. Good calls and bad ones, however it shakes out. Nothing gets filtered and nothing gets quietly dropped.
What is delayed is the announcement, and the reason is duty of care rather than concealment:
I don’t publish these live, because I don’t want people piling into a trade they can’t inspect, run on software they can’t buy.
Hooligan is an unreleased test bed. Nobody can buy the tool, nobody can check the reasoning for themselves, and the cohort is thin, volatile and unproven. Broadcasting a live entry under those conditions invites people to copy a trade they have no way of inspecting. Publishing afterwards, in full, removes that hazard without removing a single receipt.
The mechanism that makes delayed publication provable rather than merely honest is the git history. The rule and its expected trigger get committed before it fires. The write-up comes whenever it comes. The post is the narration; the commit is the receipt — and a Hooligan result doesn’t get published here without a commit hash that predates it.
Where we are
Everything is in cash. The four-year low window is open and runs to March 2027. The expectation on record, hedged, is that this begins to kick off in the autumn — and one cannot know that for sure, which is precisely the point of writing it down now instead of later.
See you at the low.
Hooligan is an unreleased test bed, is not for sale, and exists here for educational purposes. Nothing in this dev log is financial advice or a recommendation to buy any asset. Backtested results are not indicative of future performance, and the caveats above are part of the numbers rather than a footnote to them.